



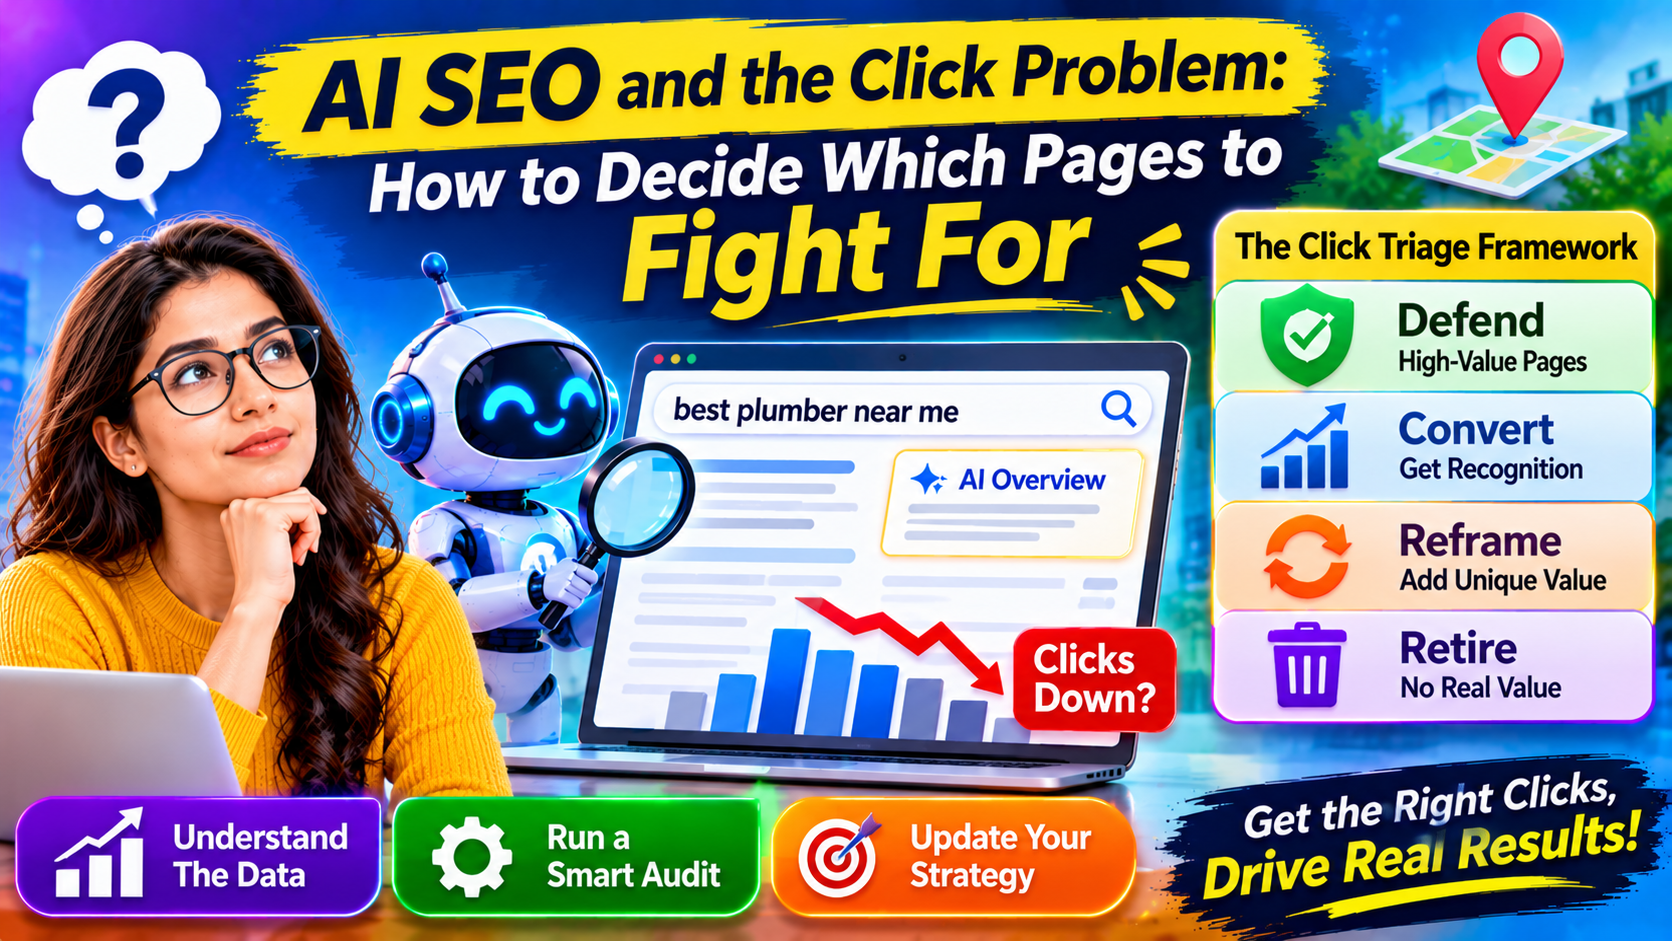
Open Search Console and compare this year with last. If your impressions are stable but clicks have slipped, you’re seeing the trade-off that defines AI SEO right now: more answers on the results page, fewer reasons to leave it.
The useful question isn’t “how do we get our clicks back?” It’s “which clicks are still worth defending, and what should the rest of our content do instead?” Sarkar SEO’s approach is to triage pages by what a lost click actually costs.
What the Click Data Says (and Doesn’t)
Several studies point in the same direction, though they disagree on size.
- Seer Interactive tracked 53 brands across 5.47 million queries from January 2025 to February 2026. Organic click-through on queries with an AI Overview was 0.61%, versus 1.62% without, per a Relevant Audience summary.
- Ahrefs, analyzing 300,000 keywords, found the top result’s click-through fell by about 58% when an AI Overview appeared.
- Pew Research found that users clicked an organic result 8% of the time with an AI Overview, against 15% without.
- A randomized field experiment, reported in a getAIrefs roundup, found a 39.8% drop in outbound clicks. That matters because it is causal evidence, not just correlation.
Now the caveat. Estimates of how many searches trigger an AI Overview range from roughly 20% to 50% depending on the tracker, according to the same roundup. Aggregator sites repeating “statistics” often contradict each other: one claims commercial queries trigger AI Overviews 71% of the time, another says 8-18%, and others say as little as 1%. Treat any single trigger-rate figure with suspicion, including those in this article.
Two patterns survive across sources:
- Coverage has spread. Semrush’s analysis of over 10 million keywords found informational queries fell from 91.3% of AI Overview triggers in January 2025 to 57.1% by October 2025. Commercial queries rose from 8.15% to 18.57%, and transactional from 1.98% to 13.94%.
- Branded queries behave differently. Digital Applied’s March 2026 analysis, cited by getAIrefs, found branded queries that show an AI Overview saw an 18% click-through increase. That suggests these answers can redirect clicks toward brands they name, rather than just suppressing them. It’s a single analysis, so treat it as a lead, not a law.
The Real Shift: Not All Lost Clicks Are Equal
Traffic is a proxy. What matters is what each click did for the business. A visit to a “what is X” explainer rarely converts directly. A visit to a pricing comparison often does. Losing 40% of the first and 5% of the second may barely move revenue, even though the traffic chart looks alarming.
So before reacting, sort your pages into four groups.
The Click Triage: Defend, Convert, Reframe, Retire
This framework is our own method, not an industry standard. It’s a way to turn messy data into decisions.
Defend: pages where the click still earns money.
These are commercial, comparison, and product-led pages where a visitor needs something an overview can’t provide: live pricing, availability, tools, demos, and detailed specs. Protect them with unique data, calculators, and first-hand testing. Make sure they load fast and are easy to crawl.
Convert: pages that get cited but rarely clicked.
Informational pages often become the source behind an answer without earning the visit. For these, the goal shifts from clicks to recognition. Put your brand name, a distinctive method, or an original statistic into the page so a reader who sees the citation remembers you and later searches for you. If branded queries respond well to AI Overviews, as the Digital Applied finding hints, this is where the payoff comes from.
Reframe: pages that answer what a summary can already answer.
Dictionary-style definitions and basic how-tos fall here. A summary can replace them. Rework each page to add what a summary can’t: an expert opinion, a template, a calculator, a real example, a contrarian view backed by evidence. If you can’t think of anything to add, move to the next group.
Retire: pages with no defensible value.
Thin pages that duplicate better sources add little. Merge them into stronger pages, redirect them, or remove them. Google’s spam policies target large volumes of low-value pages, and fewer, stronger pages tend to serve users and crawl budgets better.
How to Run the Triage in an Afternoon
- Export a year of page-level data from Search Console, and add conversion data from your analytics.
- Label each page’s dominant intent: informational, comparison, commercial, transactional, branded.
- Mark pages where clicks fell but conversions held. Those are “Convert” candidates, since the traffic was never carrying the value.
- Mark pages where both fell. Those are the urgent “Defend” or “Reframe” cases.
- Check Search Console’s generative AI report, which several 2026 guides say shows impressions in AI Overviews and AI Mode. Impressions without clicks suggest you’re being surfaced but not visited.
- Assign one action per page, and revisit quarterly.
Update Your Forecasts
One finding in the Visionary Marketing report deserves mention: it argues that forecasts built on pre-AI click-through rates may overestimate traffic by 30-50%. That figure comes from one agency’s analysis, but the logic holds. If your model assumes last year’s CTR curve, adjust it by intent type and test it against your own data before presenting growth targets.
Don’t Overcorrect
Panic produces bad content: padding pages with AI-generated filler, chasing every question keyword, or abandoning informational content entirely. Informational pages still build the authority and brand recall that help commercial pages perform. The aim is to give each page a clear job.
Google also continues to say that its AI features are built on the same core ranking systems, so quality, usefulness, and technical health remain the base. Triage decides where to spend effort, not whether to do SEO.
