



A client opens your monthly report. Rankings are stable, but sessions are down. Is the strategy failing, or has search changed underneath it?
In AI-driven search, both can be true, and old dashboards can’t tell you which. AI SEO article covers what the data says about clicks and traffic quality, what Google now lets you measure, and how to build a report that stays honest.
What the Click Studies Show
Several studies agree on direction, even if they disagree on size.
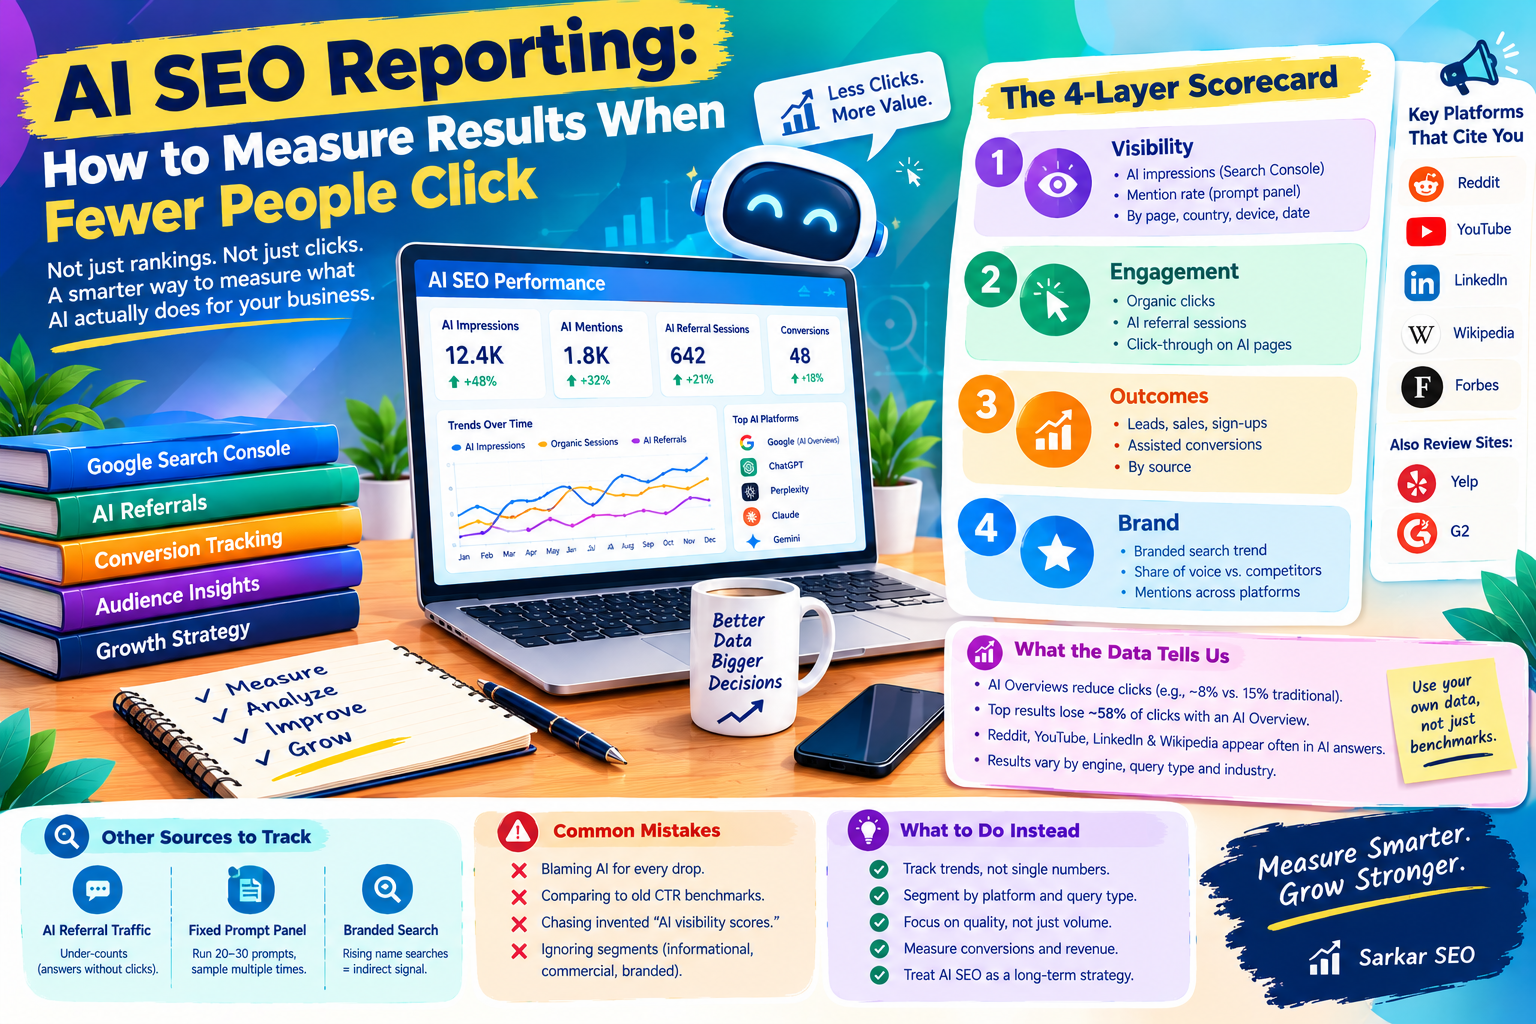
Pew Research, as summarized by secondary sources, found a traditional result earned about an 8% click rate when an AI Overview appeared, versus 15% without one. Links inside the overview itself drew roughly 1% of clicks. Separately, Ahrefs’ study of 300,000 keywords reported that position-one results lose around 58% of clicks when an AI Overview sits above them. Other roundups quote declines from 47% to 93% depending on query type.
That spread is the point. Methods, markets, and dates differ, and these figures are not interchangeable. Informational queries that an AI can answer in a paragraph appear most exposed. Treat any single percentage as a snapshot, and measure your own queries before telling anyone what “AI” cost them.
The Conversion Claims Don’t Agree Either
You will also see claims that AI referral visitors are worth far more. The numbers reported in the sources I reviewed:
- Similarweb: an 11.4% conversion rate for AI referrals versus 5.3% for organic search, about 2.15 times higher.
- Semrush, as cited by Contently: AI visitors about 4.4 times as valuable as average organic visitors.
- A figure attributed to Ahrefs: 23 times higher.
Multiples from 2 to 23 can’t all describe your site. Volumes are also small. One analysis reported that AI assistants made up only about 0.9% of referral traffic, and another put total AI referrals near 1% of publisher traffic. A high rate on a tiny base is easy to overstate. At Sarkar SEO, we advise never putting an industry multiplier in a forecast. Use your own conversion data, and say plainly when the sample is small.
What Google Now Measures
On June 3, 2026, Google announced Search Generative AI performance reports in Search Console, with separate views for Search (covering AI Overviews and AI Mode) and Discover. The reports show impressions, pages, countries, dates, and, for Search, devices. The same data remains counted inside the main Performance report.
Know the limits. Reports on the launch indicate it covers impressions, not clicks or queries, and rollout reached more sites gradually after the announcement. If you don’t see the report yet, check again later rather than assuming you have no AI visibility. Search Console also shows only your own domain, so it can’t tell you who is winning the citations you aren’t.
Another trap: some practitioners note that clicks from AI Overviews land in GA4 as ordinary organic search. Your analytics will not separate them without help from Search Console.
Measuring the Other Engines
For ChatGPT, Perplexity, Claude, and Gemini there is no official dashboard of impressions. You have three practical sources:
- Referral traffic. Check your analytics for visits from AI assistants. This undercounts, because many answers are consumed without a click.
- A fixed prompt panel. Choose 20 to 30 customer questions and run them on a schedule. Because AI answers vary between runs, run each prompt several times and report a mention rate, not a single yes or no.
- Branded search. Rising searches for your name often follow being recommended elsewhere. This is an indirect signal, not proof.
A Four-Layer Scorecard
This is my own reporting framework, built from what the sources support. Adapt it freely.
Layer 1: Visibility. AI impressions by page and country from Search Console, plus mention rate in your prompt panel. This answers: are we being surfaced?
Layer 2: Engagement. Clicks from organic search, AI referral sessions, and click-through on pages that appear in AI features. This answers: are people visiting?
Layer 3: Outcomes. Leads, sales, or sign-ups by source, including assisted conversions. This answers: does it matter commercially?
Layer 4: Brand. Branded search trend and share of voice against named competitors in your panel. This answers: are we becoming the default name?
Report all four together. A fall in Layer 2 alongside growth in Layers 1 and 4 tells a different story than a fall in all four.
A Hypothetical Reading
Imagine a software firm sees organic sessions drop 15% over a quarter while AI impressions rise, branded search grows, and demo requests hold steady. A sessions-only report calls that a failure. The scorecard suggests a shift in how people arrive, not a loss of demand. This is an invented example to show the logic, not a client result.
Mistakes That Distort Reports
Blaming AI for every drop. Core updates, seasonality, and technical issues also cut traffic. Google’s May 2026 core update, for example, ran from May 21 to June 2, according to one report. Check update timing before assigning cause.
Comparing to old click-through benchmarks. Position-one CTR curves from before AI features no longer apply on many queries.
Chasing invented “AI visibility scores.” Proprietary scores can be useful for trend lines, but ask what is measured and how. If the method is opaque, don’t headline it.
Ignoring segments. Informational, commercial, and branded queries behave differently. Averages hide the pattern.
How to Set a Baseline This Month
Export the last 12 months of Search Console data by query type. Record current AI impressions if the report is available. Build your prompt panel and run it three times. Pull conversions by source. That gives you a starting point to judge change against, which beats any benchmark borrowed from another industry.
