



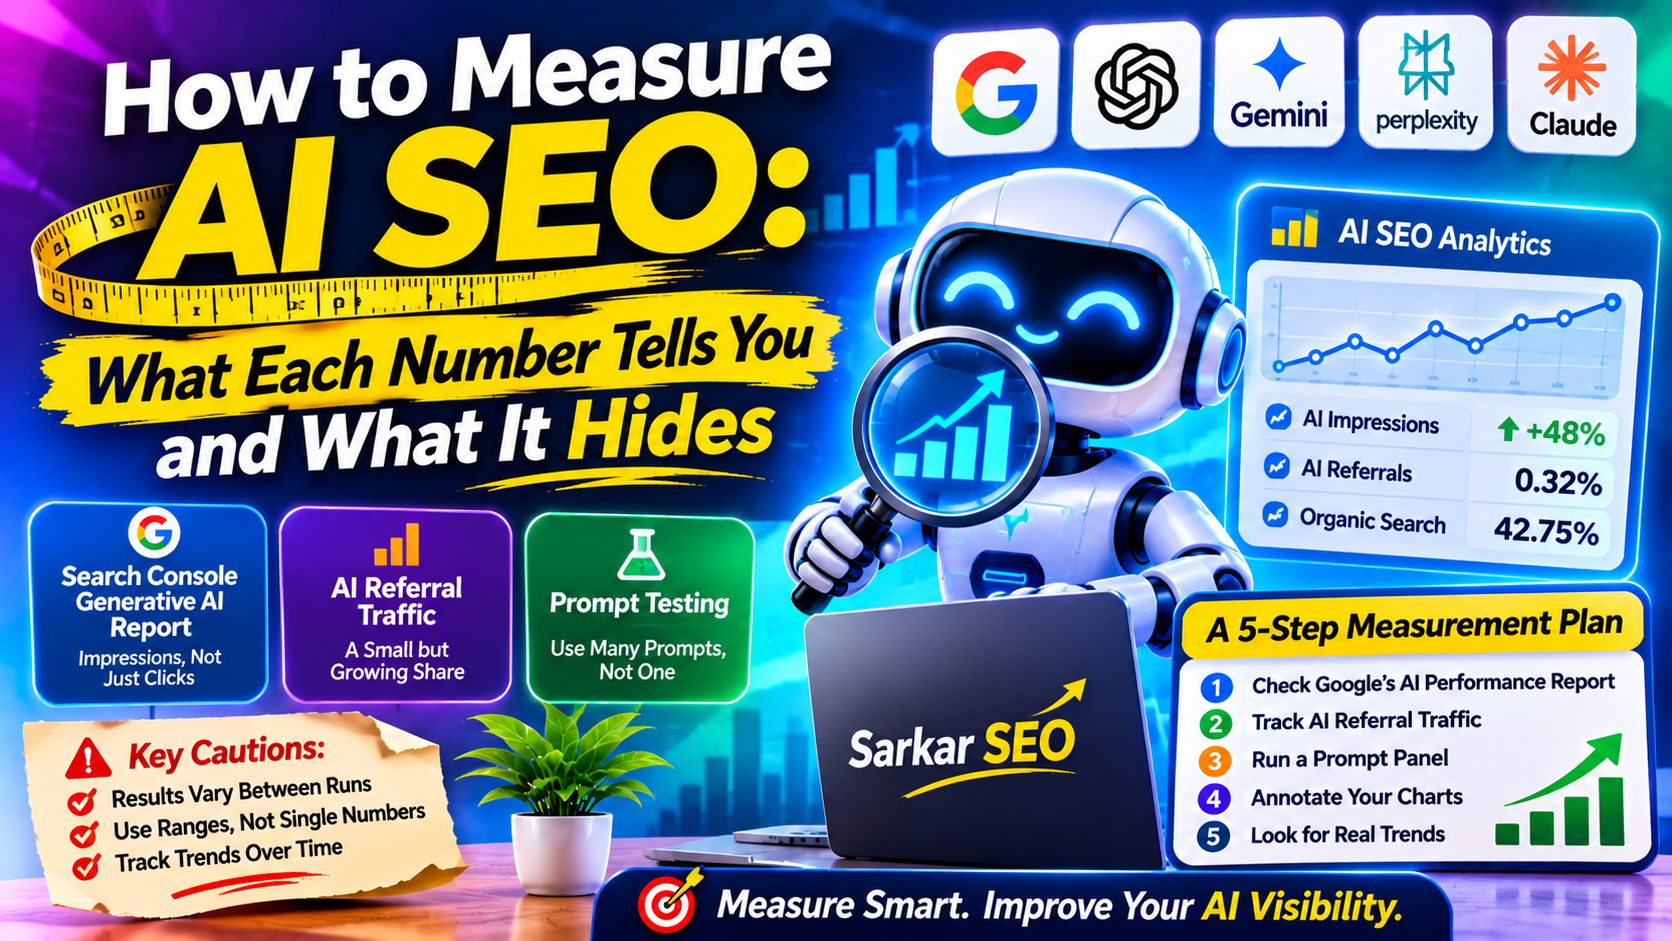
Measuring AI SEO is harder than measuring classic SEO because no single report covers every AI surface. A workable setup has three parts: Google’s own Generative AI performance report for Google’s AI features, analytics for the small but growing stream of AI referrals, and repeated prompt sampling for answer engines such as ChatGPT, Gemini and Perplexity. The common mistake is treating one prompt result as a verdict. Sarkar SEO’s view is that AI SEO reporting should resemble a poll, with ranges and sample sizes, not a scoreboard.
What Google’s Generative AI performance report shows
Search Console’s Generative AI performance report counts impressions: how often links to your site appeared in AI Overviews and AI Mode on Google Search. According to Google’s documentation, you can split the data by page, country, date and device, and separate text searches from multimodal ones such as Google Lens or Circle to Search. As of August 31, 2026, it is available to all websites worldwide, though it only appears once a site has received enough AI impressions.
Know its limits before quoting it. The report excludes Search Labs experiments and Discover, which has its own report. It carries the standard 1,000-row cap, the newest data may be preliminary, and chart totals can differ from table totals because they aggregate differently. Exports also convert values shown as “~” or “-” into zeros, which can make thinly covered pages look invisible.
Because the documented metric is impressions, pair it with the regular Performance report to see clicks. Then sort the page view by impressions. Pages Google’s AI features already surface are your best candidates for fresher examples or original data, because they have visibility worth defending.
What AI referral traffic can and cannot tell you
SE Ranking analyzed 101,574 Google Analytics websites across 250 countries and territories. It found AI platforms sent 0.32% of total traffic from January to April 2026, up from 0.02% in 2024, or roughly one visit in 312. Organic search accounted for 42.75% in the same dataset. Within AI referrals, ChatGPT supplied 74.78%, Gemini 11.56%, Perplexity 7.23%, Copilot 3.51% and Claude 2.62%. By region, AI’s share was 0.29% in the US, 0.27% in the EU and 0.16% in the UK.
These figures describe one dataset and one vendor’s data, so use them to judge scale, not to set targets. The practical lesson is that referral sessions are a tiny, lagging signal. A page can shape an answer without earning a click, so a flat AI referral line does not prove invisibility. Segment it by source each month anyway, because the mix between platforms shifts.
The trap: one-off citation checks
Many teams test answer engines by asking a question and noting whether their site appears. A 2026 arXiv preprint by Sielinski shows why that misleads. It repeatedly queried Perplexity, OpenAI’s SearchGPT and Google Gemini with 200 generated queries per topic, and cited sources changed substantially between runs.
The median overlap between citation sets for the same query was about 0.29 to 0.31 on Gemini, 0.33 to 0.40 on SearchGPT and about 0.50 on Perplexity, where 1.0 means identical. One domain’s citation share on SearchGPT ranged from roughly 9% to 16% over nine days. Bootstrap intervals for top domains were typically three to six percentage points wide, so a 3.5-point gap between two domains can be pure noise.
The authors’ convergence analysis suggests how many queries are enough to estimate citation share within an interval about five points wide: roughly 40 to 50 for Gemini, about 100 for Perplexity and at least 150 for SearchGPT. They also advise fixing the sample size in advance, rather than stopping when the numbers look good.
Limits apply. The queries were LLM-generated, covered three consumer topics and ran for only nine days. Treat the numbers as a caution about method, not a universal constant.
A measurement setup that fits a small team
Sarkar SEO suggests three rules for the prompt panel. First, fix the query list and sample size before you start, and use far more than ten prompts. Second, report ranges, such as “cited in 18% to 26% of responses”, never a single figure. Third, treat movement inside the margin as noise and act only on shifts that persist for several months.
Here is a hypothetical example. Say your panel of 100 prompts cites you in 22 responses in March and 27 in April. That five-point rise sits inside the three-to-six-point intervals reported above, so it is not yet evidence of progress. Sarkar SEO would wait for a second and third month before crediting any content change.
Annotate your charts too. Search Console supports custom annotations, so you can mark page updates and Google announcements, then compare impressions before and after instead of guessing.
If you serve several markets, use the country dimension to compare them. The referral data above shows AI’s share of traffic varies by region, so a single global average can hide where AI visibility is actually building.
