



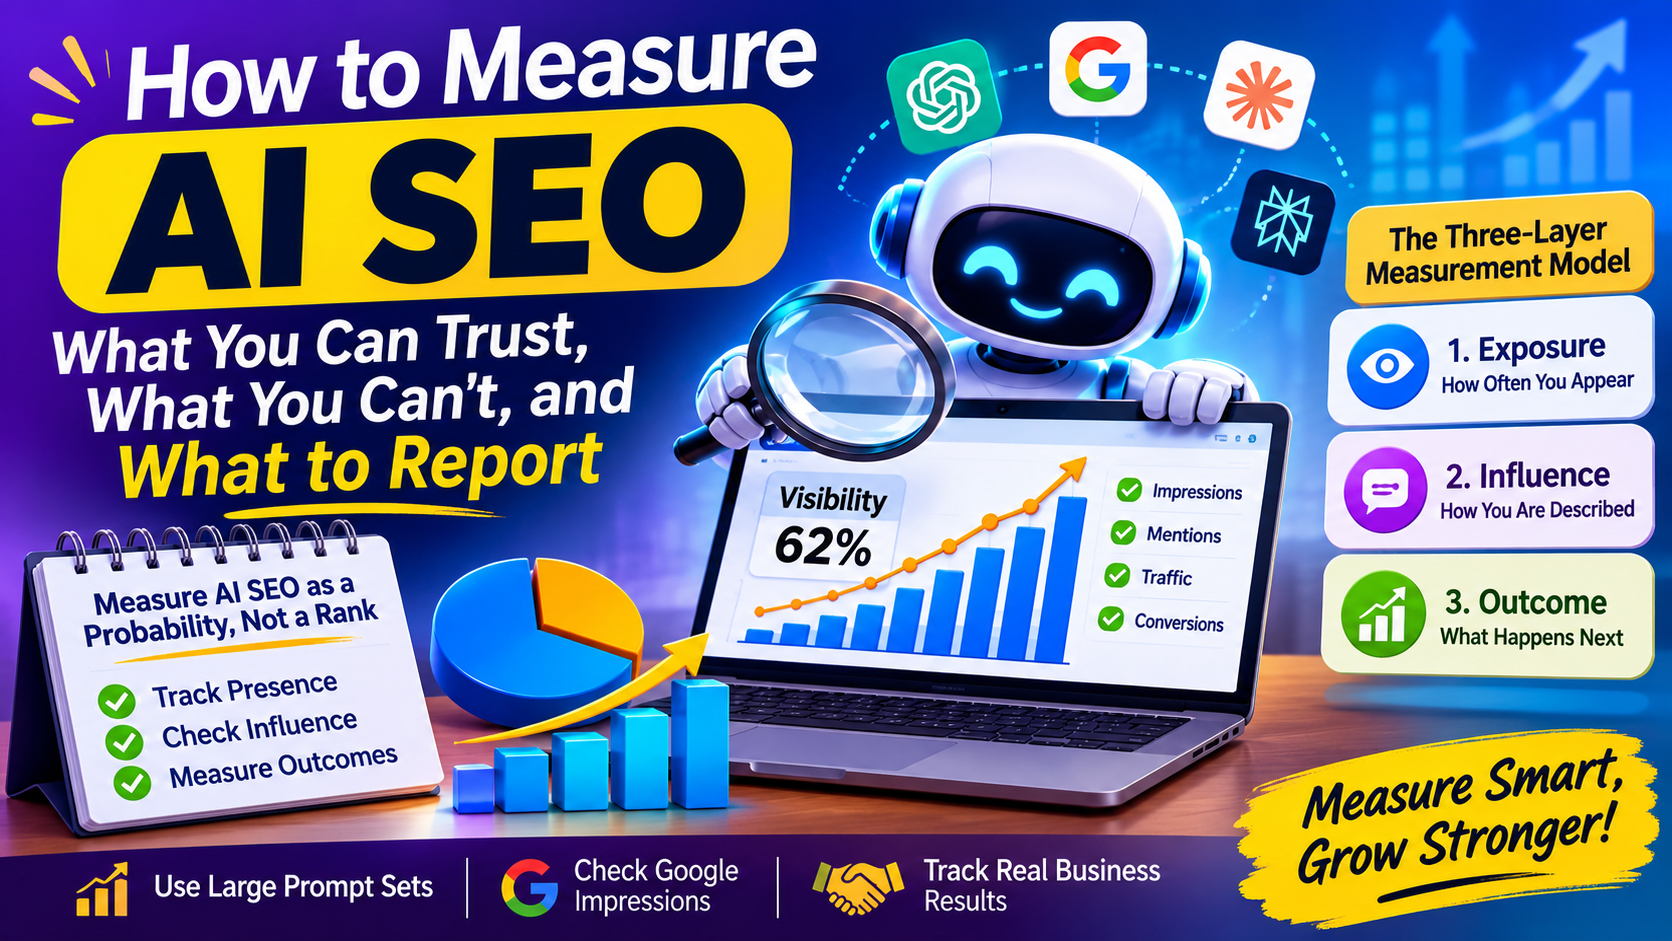
AI SEO is hard to measure because the old yardsticks no longer fit. There is no rank 3 inside a chatbot answer, and the same question can name different brands each time it is asked. Yet clients and executives still ask the same thing: is it working?
The short answer: measure AI SEO as a probability, not a position. Track how often you appear across a large, fixed set of prompts, pair that with Google’s own impression data, and judge the result by business outcomes, not screenshots.
Why Screenshots and Rank Trackers Mislead
A SparkToro and Gumshoe study had about 600 volunteers run 12 identical prompts nearly 3,000 times across ChatGPT, Claude and Google’s AI. The chance of receiving the same brand list twice was under 1 in 100, and the same list in the same order about 1 in 1,000. List length varied too.
The useful finding is what stayed stable. Some brands appeared in 60% to 90% of responses for a given intent, even as their positions shifted. The authors concluded that repeat presence is meaningful and exact rank is not. They also saw steadier results in smaller markets, such as regional services or niche B2B tools, than in crowded categories.
So a single screenshot proves almost nothing, and a tool reporting that you moved from fourth to second is describing noise.
A Worked Example of Sample Size
Suppose your brand appears in 6 of 10 test runs. That reads as 60%, but the plausible range is wide: a standard 95% interval (Wilson method) runs from roughly 31% to 83%. If next month shows 5 of 10, you cannot claim a decline.
Scale the same 60% to 100 runs and the range tightens to about 50% to 69%. At 1,000 runs it is about 57% to 63%. This is simple statistics, not a finding from the studies above, but it explains why small prompt sets cannot support trend claims. Ahrefs makes a related point, arguing that many tools cap tracking at 50 to 100 queries. That is a vendor’s view, but the arithmetic backs the concern.
Scope matters as much as volume. In an Ahrefs example, Pipedrive held about 92.8% share of voice on roughly 7,000 prompts for one CRM subtopic, but only 3.6% across about 128,000 prompts spanning the whole CRM market. Both numbers are true. They answer different questions.
What Google’s Report Does and Does Not Tell You
Google announced its Generative AI performance reports on June 3, 2026, starting with a subset of site owners. They show impressions from AI Overviews and AI Mode combined, the URLs that appeared, and breakdowns by page, country, device and date.
They do not show queries, clicks, click-through rate, average position, which passage Google used, or revenue. Counting rules also differ: an AI Overviews link must be scrolled or expanded into view to count, while in AI Mode a follow-up question counts as a new query.
Treat it as a trustworthy but partial signal. It confirms exposure on your own pages and shows which ones. It cannot tell you whether anyone acted.
The Three-Layer Measurement Model
At Sarkar SEO, we organize AI SEO reporting in three layers, so that no single noisy number carries the whole argument.
Layer 1: Exposure. How often you appear. Use a fixed prompt set of at least a few hundred prompts grouped by topic, repeated on a schedule against the same named competitors. Add Google’s impression data for pages. Report visibility percentage with its range, never a rank.
Layer 2: Influence. How you are described. Record the adjectives, the competitors grouped with you, and any wrong claims. Also watch branded search demand, since people who see a recommendation often search the name later. That link is plausible but not proven, so label it a correlation.
Layer 3: Outcome. What happened afterward. Track visits from AI platforms, then sign-ups, enquiries or sales. Add a “how did you hear about us” field, because attribution leaks.
Tracking the Visits You Can Actually See
Ahrefs reported that AI search visitors made up about 0.5% of its own traffic but 12.1% of sign-ups, and converted at roughly 23 times the rate of organic search visitors. The figures are undated, come from one company’s analytics, and shouldn’t be assumed for your site. Small volumes can produce dramatic ratios.
The practical lesson is about attribution. A custom GA4 segment filtering referral sources such as chatgpt.com, claude.ai, gemini.google.com and perplexity can catch part of it. Some visits, especially from mobile apps, arrive as direct traffic. Self-reported onboarding answers help, though they depend on what people remember.
A Monthly Reporting Template
- Visibility percentage for each topic, with the number of runs and range.
- Topic gaps: prompts where named competitors appear and you do not.
- Accuracy log: wrong or outdated statements about your brand, with the pages that should correct them.
- Google impressions for AI features, by key page group.
- AI-referred sessions and conversions, labeled as a minimum.
- One action taken because of the data. If no data changed a decision, the report is decoration.
Keep the prompt set frozen for at least a quarter. Sarkar SEO treats any change to it as a new baseline, never a continuation.
