



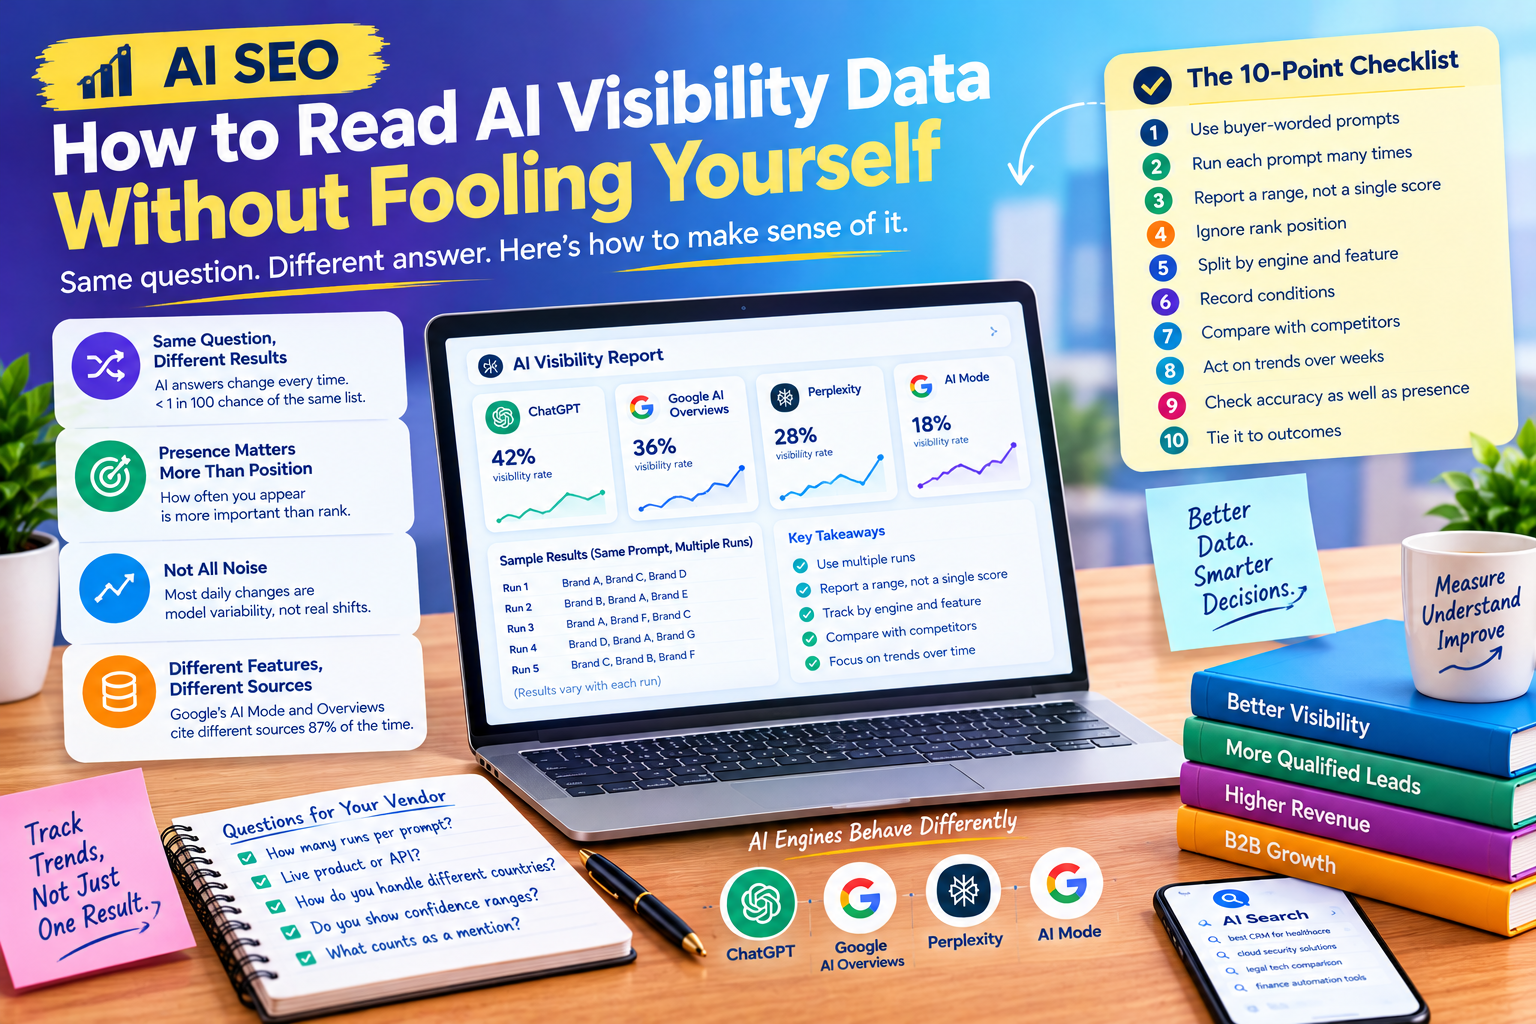
AI visibility dashboards are now easy to buy and easy to misread. AI SEO score drops three points and someone wants to know what went wrong. A competitor appears above you in a screenshot and a meeting is called. The trouble is that the thing being measured changes every time you ask. At Sarkar SEO, we think knowing how to read this data matters as much as collecting it. Here is what the research says and how to apply it.
The Same Question Rarely Gets the Same Answer
The most cited test comes from SparkToro and Gumshoe.ai. As summarised by Search Engine Journal, it found a less than 1-in-100 chance that ChatGPT or Google’s AI in Search would return the same list of brands across repeated runs of the same prompt. A research summary adds that fewer than 1 in 1,000 repeat runs produced the same brands in the same order. searchenginejournalthrivestack
The design matters. The summary describes 600 volunteers running 12 brand-recommendation prompts through ChatGPT, Claude and Google’s AI surfaces 2,961 times, at 60 to 100 runs per prompt per engine. It also notes the study is not peer reviewed, and the authors disclose a commercial interest in AI tracking. So treat it as strong evidence from interested parties, not settled science.
Position Is Noise, Presence Is Signal
The same study contains a more useful finding. Despite the shuffling, the AI tools returned brands from a relatively consistent consideration set. Another summary reports that visibility percentage across many queries shows more consistency than ranking position. searchenginejournalsearchenginejournal
In practice, “we are recommended first” is a weak thing to measure, while “we appear in 40% of responses to this question” is much stronger. A separate analysis of ChatGPT B2B software recommendations found that only about five brands, on average, appeared more than 80% of the time across 100 runs. That is one author’s data, but it fits the picture: a small group dominates, and everyone else fights for occasional mentions.
Not Everything Is Randomness
It would be wrong to conclude that nothing is stable. A July 2026 study from Lantern, an AI commerce vendor, looked at about 3,300 shopping recommendation trends and reported that whether a brand appeared stayed unchanged across the tracking period in 80% of brand-prompt-model combinations. It also found that brands holding the number one recommendation kept that position in roughly two-thirds of tracked combinations. Its conclusion is that much daily movement reflects model variability, not real change.
Two caveats apply. This is again vendor research, and one tracks shopping while the other tracks general recommendations. Still, they agree on the core point: large day-to-day swings are mostly noise, while slow shifts in how often you appear deserve attention.
Different Features, Different Sources
Variability also runs across features of the same platform. The Search Engine Journal report notes that Ahrefs found Google’s AI Mode and AI Overviews cite different sources 87% of the time for the same query. A tracker that blends them together may hide the fact that you are visible in one and absent in the other. Report each surface separately.
Why It Varies
One technical explainer lists causes: search augmentation can return different documents as indexes change, and a prompt may pass through a different model version, retrieval layer or safety classifier tomorrow. You cannot control these, so the sensible response is to measure over time instead of seeking a fixed truth.
Why Sample Size Matters
Here is a calculation of our own to show the problem. If your brand appears in 6 of 10 runs, a standard 95% confidence range for its true appearance rate runs from about 31% to 83%. If it appears in 60 of 100 runs, the range narrows to about 50% to 69%. The same 60% reading means very different things depending on how many runs sit behind it. One explainer makes the same point: a brand appearing in 6 of 10 outputs does not provide the same evidential strength as appearing in 60 of 100.
One commentator argues that most tools check each prompt just once per time period, and that a reliable score requires dozens or even 100+ runs. I could not verify how every vendor works, so ask directly.
Rules for Reading Your Data
This checklist is our own working method, not an industry standard.
- Use buyer-worded prompts. Write them from real customer questions and sales calls, not from your own jargon.
- Run each prompt many times. Aim for dozens, and use more when the decision is expensive.
- Report a range, not a single score. “Between 45% and 65%” is honest.
- Ignore rank position. Track how often you appear, not where.
- Split by engine and feature. ChatGPT, Perplexity, Google’s AI Overviews and AI Mode behave differently.
- Record conditions. Date, model, location, logged-in state and whether the tool had web search on.
- Compare against a stable set of competitors. Your share relative to theirs is more telling than your absolute figure.
- Act on trends over weeks. A one-week dip is rarely a reason to rewrite a page.
- Check accuracy as well as presence. Note wrong prices, retired features and misdescribed services.
- Tie it to outcomes. Pair visibility with enquiries, branded searches and sales.
Questions to Ask a Tracking Vendor
The study’s authors urge buyers to make providers answer their questions and show their math. Good questions include: How many times is each prompt run? Do you use the live product or an API, and does it match what customers see? How do you handle different countries and languages? Do you show confidence ranges? What counts as a mention? The study itself left open how many runs are needed for reliable data and whether API calls vary the same way as manual prompts, so a vendor who claims certainty deserves scrutiny.
